
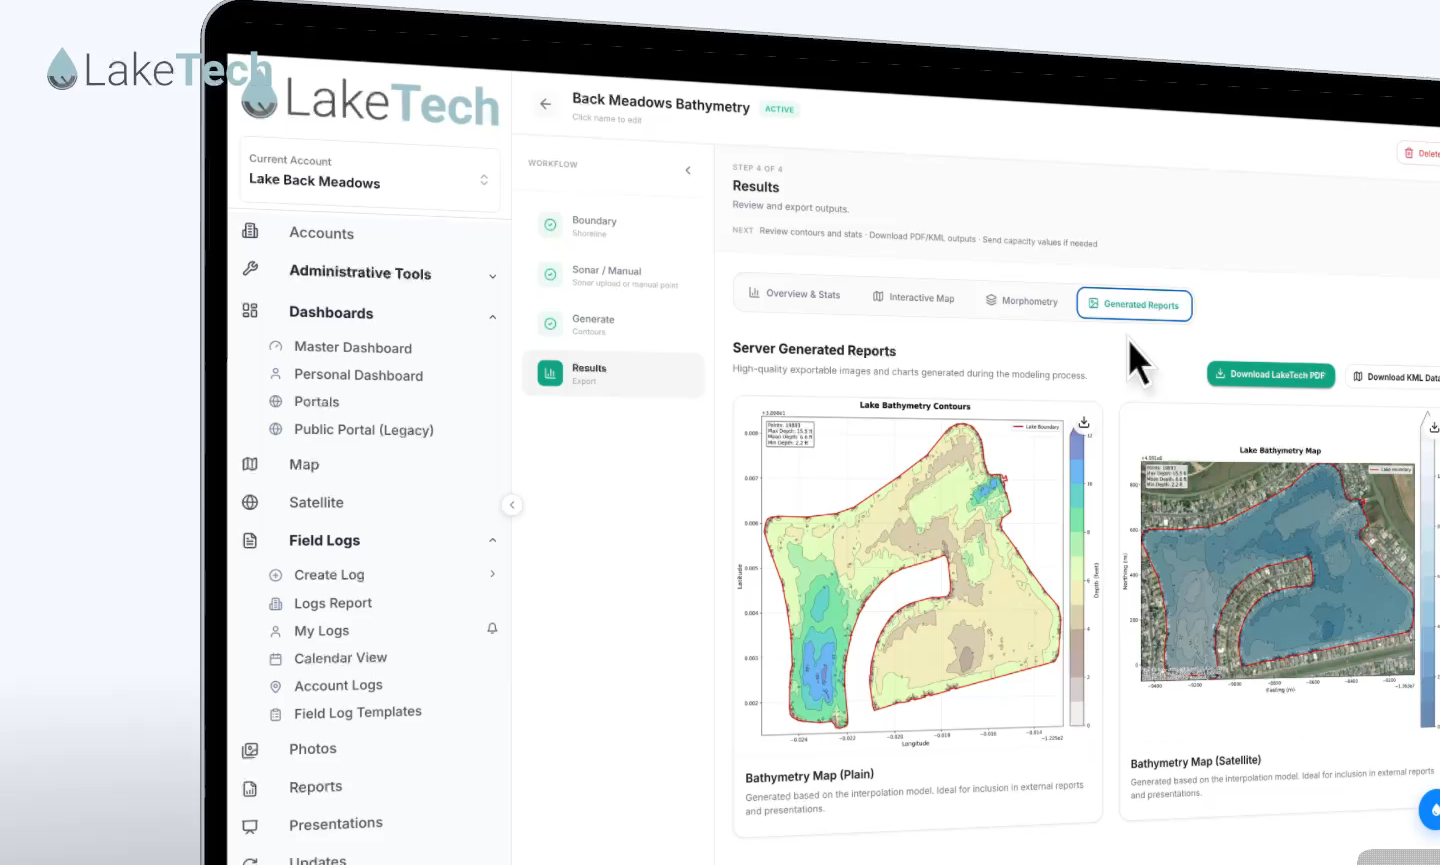
A depth map of your lake, built from data you already collect
Knowing the shape of a lake below the waterline changes how you manage it. Depth, volume, and basin structure drive everything from treatment dosing and aeration sizing to dredging plans and capacity studies. Until now, getting that picture usually meant hiring a survey crew or waiting on an outside consultant to process raw sonar files.
LakeTech Mapping brings that work into your dashboard. If you have run a sonar unit across your waterbody, you already have what you need. Upload the logs, trace the shoreline, and our platform builds a full bathymetric model with contours, depth statistics, and export-ready reports. The result is a clear, shareable map of your lake bottom that you own and can regenerate any time your data changes.
From sonar logs to a finished map in four steps
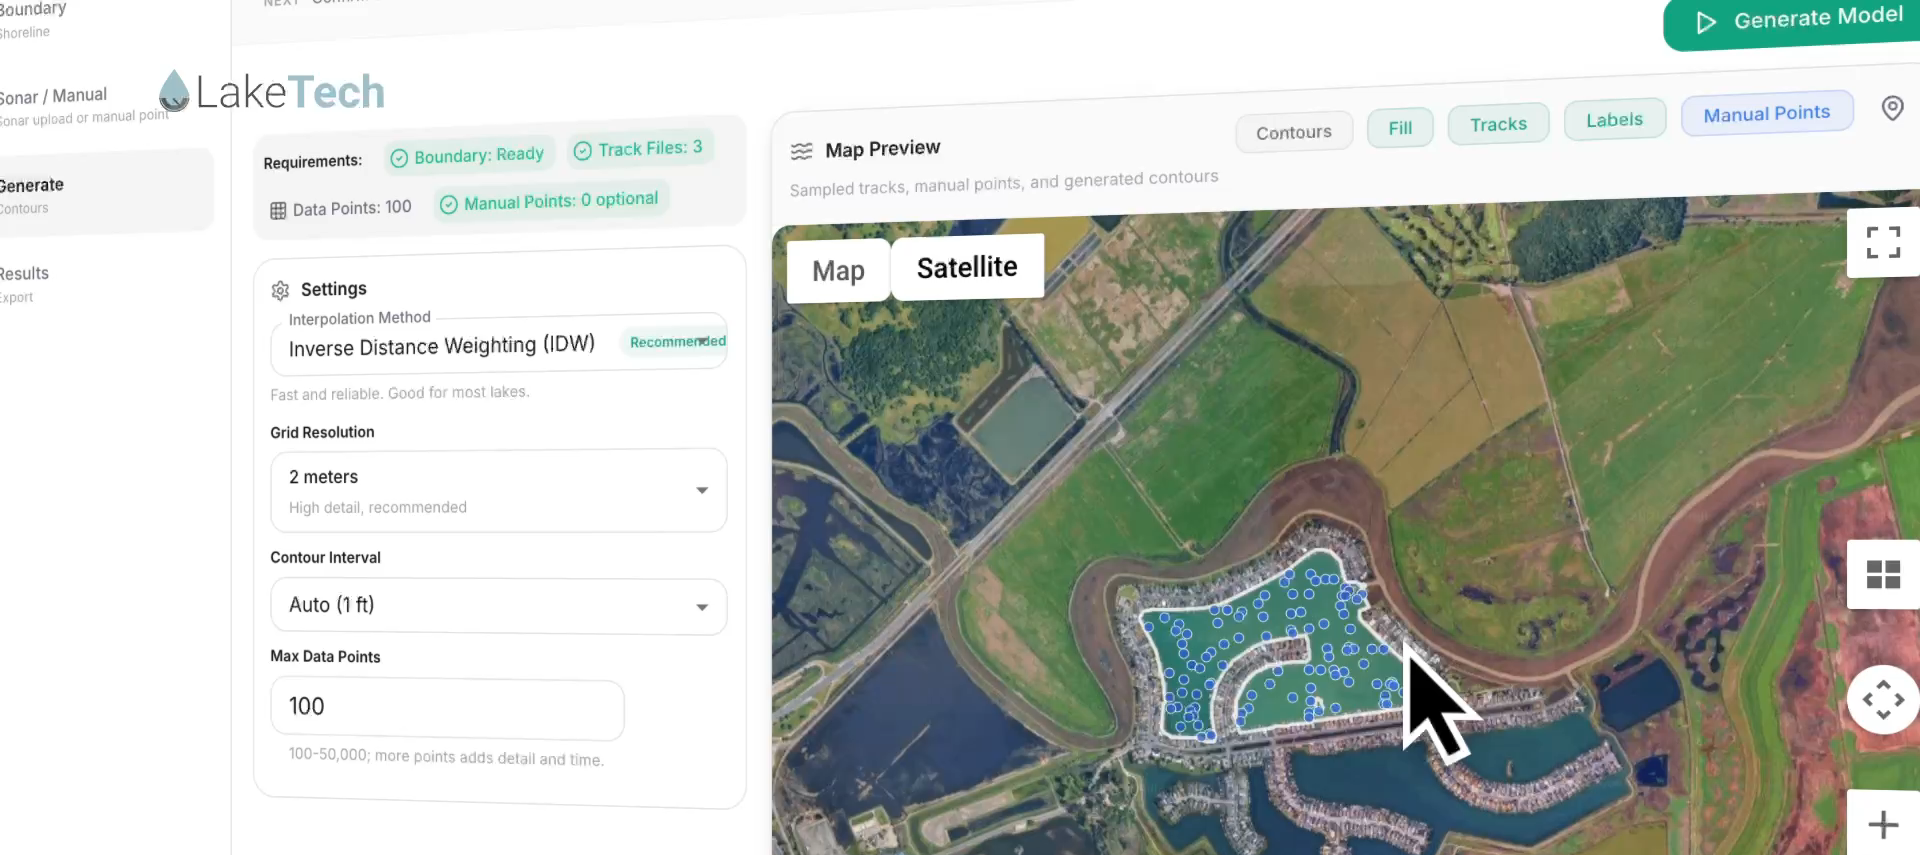
The mapping workflow walks you through the whole process in a fixed order, so you always know what comes next. You start by defining the lake boundary, which sets the shoreline the model fills to. Then you bring in your data by uploading sonar track files or dropping in manual depth points where you have them.
With a boundary and depth data ready, you move to the generate step to choose your contour settings, and finally to results, where you review and export everything. Each step shows a live requirements checklist, so you can see at a glance when your boundary is set and how many track files and data points the model will use.
- Boundary: trace or import the shoreline that defines the lake edge.
- Sonar and manual: upload track logs and add manual depth points as needed.
- Generate: pick your interpolation method, resolution, and contour interval.
- Results: review the interactive map and stats, then export.
- Works with sonar logs from Lowrance, Garmin, and Humminbird, plus generic CSV depth data.
Modeling controls tuned for real lakes
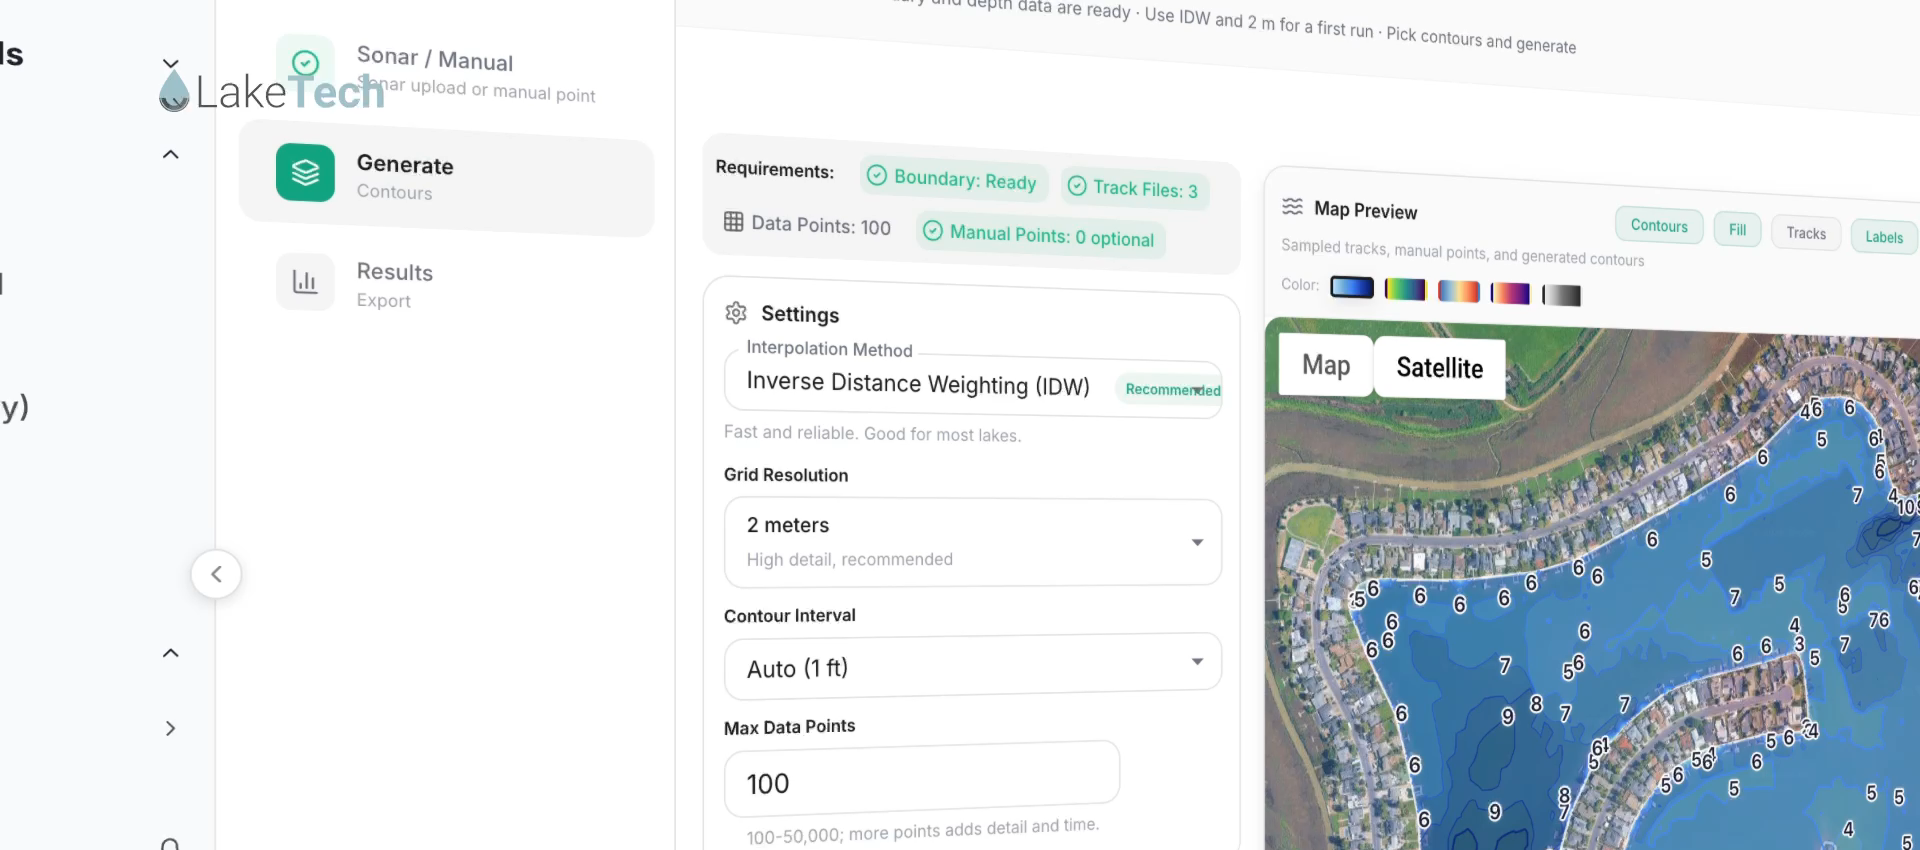
Good maps come from sensible modeling choices, and the generate step keeps those choices approachable. The default interpolation method is Inverse Distance Weighting, which is fast, reliable, and a solid starting point for most lakes. You set the grid resolution to control detail, choose a contour interval such as one foot, and cap how many survey points feed the model, anywhere from one hundred up to fifty thousand as you trade speed for density.
As you adjust settings, a live map preview updates so you can see your tracks, generated contours, depth fill, and labels before committing. You can toggle between a plan map and satellite imagery, switch color ramps, and drop in manual points to refine areas the sonar missed. When you generate, the model runs on our servers and keeps working even if you close the page, so a full basin can be built in seconds to minutes while you move on to other work.
- Inverse Distance Weighting interpolation, recommended for most waterbodies.
- Adjustable grid resolution for higher or lower detail.
- Selectable contour intervals, including automatic spacing.
- Manual depth points to fill gaps in sonar coverage.
- Server-side generation that continues after you leave the page.
Every number your reports and plans need
A map is only useful if it comes with the numbers behind it. Each generated model produces the core metrics lake managers rely on: surface area in acres and hectares, total volume in acre-feet, maximum and mean depth, shoreline length, and the depth range across the basin. You also get the modeling details, including the interpolation method, grid resolution, grid cell count, and the number of survey points used.
For deeper analysis, the report includes morphometric indices such as volume development, relative depth, mean depth ratio, shoreline development, and dynamic ratio, along with a hypsographic breakdown of area and volume by depth. When you are ready to share, export a formatted PDF report, download KML data for use in other mapping tools, save the plan and satellite map images, or add the model to your Master Map alongside your other lake data.
- Surface area, total volume, maximum depth, mean depth, and shoreline length.
- Morphometric indices and a hypsographic area and volume breakdown.
- Formatted PDF report for external reports and presentations.
- KML export for use in other mapping and GIS tools.
- Add the finished model to your Master Map in one click.
Build a clearer picture of your lake
LakeTech Mapping is built for the people who manage waterbodies day to day: lake managers, HOAs, water districts, consultants, and researchers who need dependable depth and volume data without a separate survey contract. Because the maps come from your own sonar runs, you can remap after a drawdown, a dredging project, or years of sediment change and watch how the basin evolves over time.
The feature is live in your LakeTech dashboard now under Bathymetry and Maps. If you have sonar logs ready, you can generate your first map today. If you would like a walkthrough or help getting your existing data in, our team is glad to help you get set up.