Skip to content
Lake and pond expertiseSoftware, monitoring, and consulting
LakeTech homeFundamentalsLake and Pond Measurements Guide
Measurement fundamentals

Lake and Pond Measurements Guide

Managing a lake or pond starts with understanding what is happening in the water. This guide covers the core measurements that drive informed decisions, from dissolved oxygen and temperature profiles to nutrient concentrations and streamflow, along with practical guidance on equipment, timing, and data interpretation.

LakeTech provides lake and pond management products, software, and consulting services.

Articles

Explore Measurements topics

Measurements · Source-backed

Recreational-Water Bacteria Sampling: From Decision Rule to Laboratory Handoff

A method- and laboratory-controlled workflow for freshwater recreation stations, timing, event triggers, sterile collection, quality controls, custody, holding requirements, and authority handoff.

Read more →
Measurements · Source-backed

Water-Quality Meter and Sonde Calibration, Verification, and Field Service

A project-controlled method for preparing, checking, servicing, and documenting field meters and continuous sondes while preserving as-found evidence, raw records, affected intervals, and review ownership.

Read more →
Measurements · Source-backed

Lake Water Sample Collection, Handling, and Custody

A method-first field guide for collecting representative lake and reservoir water samples, controlling contamination, preserving collection-to-receipt evidence, and handing samples to the laboratory without inventing universal bottle or holding-time rules.

Read more →
Measurements · Source-backed

Aquatic Vegetation Survey, Identification, and Mapping

A defensible lake and reservoir macrophyte survey guide connecting objectives, survey-unit design, field and mapping methods, taxonomic confidence, repeatability, safety, spread prevention, and raw evidence.

Read more →
Measurements · Source-backed

Shoreline and Littoral Habitat Assessment

A defensible lake and reservoir field guide for observing shoreline, riparian, bank, drawdown, and littoral habitat while preserving water-level context, repeatability, sensitive-resource controls, and the boundary between evidence and management authority.

Read more →
Measurements · Source-backed

Lake Level and Groundwater-Surface-Water Connectivity Assessment

A defensible investigation guide for relating lake stage, water-budget components, groundwater heads, exchange-method evidence, shoreline source hypotheses, spatial data, uncertainty, permissions, privacy, and decisions without turning correlation into cause.

Read more →
Measurements · Source-backed

Lake Sediment Characterization, Contaminants, and Dredging Investigation

Design a decision-grade lake-sediment investigation that preserves spatial and vertical support, sample condition, dry-weight and density basis, contaminant and geotechnical evidence, QA/QC, uncertainty, regulatory handoffs, and post-dredging verification.

Read more →
Measurements · Source-backed

Freshwater HAB Observation, Sampling, and Cyanotoxin Analysis

Build an authority-aware freshwater HAB evidence event from safe observation and decision-specific design through laboratory preflight, controlled sample fractions, microscopy, pigments, toxin and gene methods, quality review, satellite context, and bounded handoff.

Read more →
Measurements · Source-backed

Freshwater Ammonia Sampling and Analysis: From Paired Field Context to Qualified Result

Design a decision-led freshwater ammonia workflow that locks the measurand and laboratory method, pairs field context, follows method-specific handling, preserves custody and QC, and validates the qualified result.

Read more →
Measurements · Source-backed

Environmental Incident Observation and Authority-Directed Sampling: From Safe Documentation to Qualified Results

Design an incident measurement workflow that begins with safe observation, requires explicit sampling authorization, follows method- and laboratory-specific instructions, preserves custody and QC, validates results, and keeps substance identity, source attribution, cleanup, and public status separate.

Read more →
Measurements · Source-backed

Fish-Tissue Contaminant Monitoring for Lakes: From Program Question to Validated Dataset

Design fish-tissue monitoring around the consuming population, waterbody, species, size, edible tissue, analytes, authorized collection, laboratory quality system, and explicit inference limits required for an issuing authority's risk-assessment handoff.

Read more →
Measurements · Source-backed

Find Critical Nutrient Source Areas Without Turning a Map Into a Verdict

Screen where nutrient sources, mobilization, and connected transport pathways may coincide, then verify the evidence, uncertainty, access, privacy, and treatability before prioritizing action.

Read more →
Measurements · Source-backed

Build a Defensible Lake Hydroclimate Baseline, Trend, and Future-Conditions Evidence Package

Assemble observations, normals, extremes, trends, forecasts, projections, scenarios, and modeled lake responses with complete spatial, temporal, method, model, and uncertainty lineage.

Read more →
Measurements · Source-backed

Design Aquatic Invasive Animal Early-Detection Surveillance and Verification

Design risk-informed, multi-method surveillance for non-plant aquatic animals while preserving method, life-stage, effort, biosecurity, taxonomic, laboratory, eDNA, and inference limits.

Read more →
Measurements · Source-backed

Assess Lake and Reservoir Source-Water Susceptibility and Design Intake Monitoring

Build a source-pathway-receptor susceptibility record and a decision-specific monitoring design while preserving utility, authority, security, laboratory, and inference boundaries.

Read more →
Measurements · Source-backed

Dam Surveillance, Instrumentation, and Performance Monitoring

Build reproducible stage, inspection, instrumentation, water-control, as-operated, downstream, and qualified-review evidence without supplying operating instructions.

Read more →
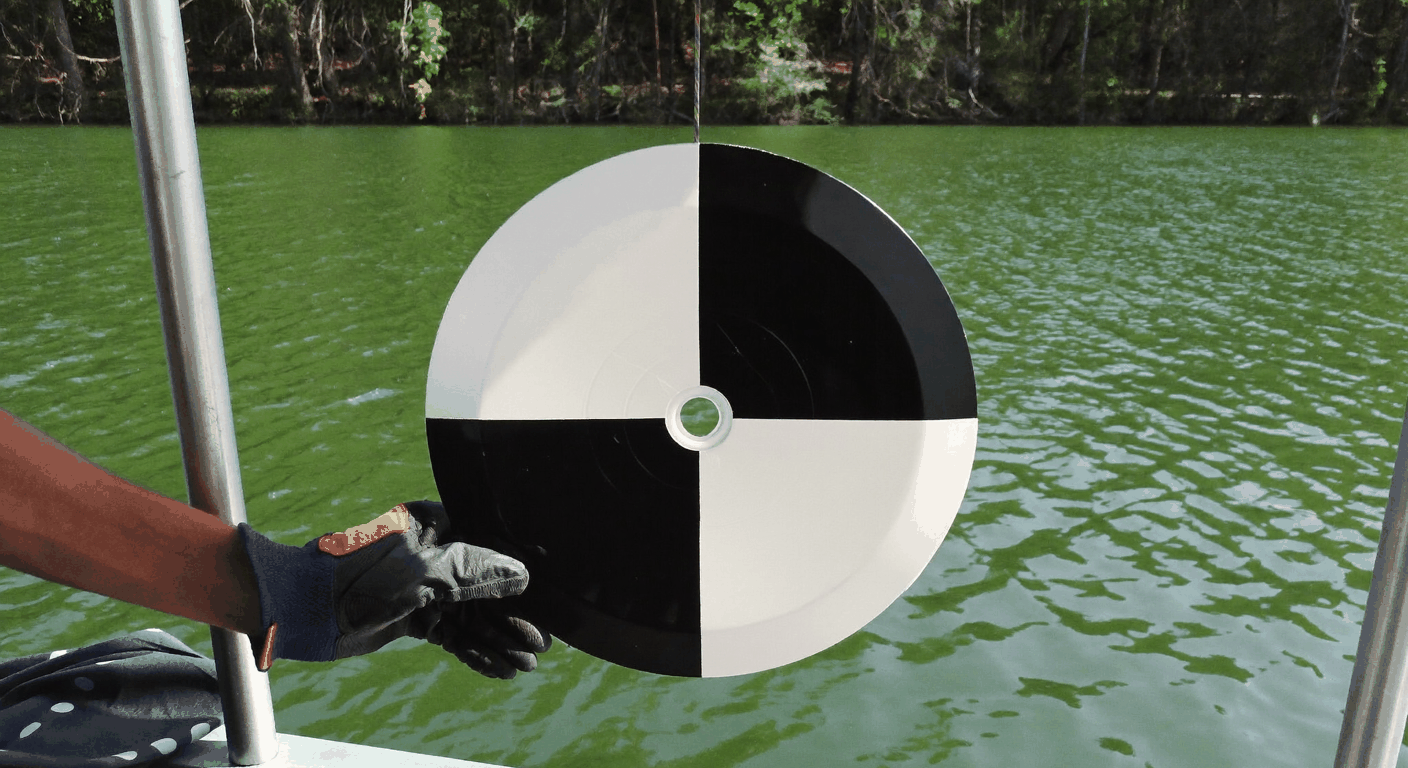
Gloved hand lowering a black and white Secchi disk into green lake water beside a boat
Measurements

Streamflow Measurements for Lakes and Ponds

Learn how to measure streamflow in tributaries and outlets connected to lakes and ponds, including stage measurement, discharge calculation, and equipment options.

Read more →
Natural pond with water lilies in bloom and a densely vegetated forest shoreline
Measurements

Dissolved Oxygen Monitoring in Lakes and Ponds

How to measure dissolved oxygen in lakes and ponds, including optical and electrochemical sensor methods, profile techniques, and data interpretation for lake management.

Read more →
Golf course pond with a spray fountain running beside a fairway
Measurements

Water Temperature and Thermal Stratification in Lakes

How to measure water temperature in lakes, understand thermal stratification and turnover, and use temperature profiles to inform lake management decisions.

Read more →
Aerial view of a neighborhood lake bordered by homes, a dock, and a walking path
Measurements

Turbidity, Secchi Depth, and Water Clarity in Lakes

How to measure water clarity in lakes using Secchi disks, turbidity sensors, and total suspended solids analysis. Practical guidance on methods, interpretation, and monitoring.

Read more →
City park lake with people walking a shoreline path and small boats on the water
Measurements

Nutrient Sampling: Phosphorus and Nitrogen in Lakes

How to collect and interpret phosphorus and nitrogen samples from lakes and ponds. Covers sampling methods, nutrient forms, laboratory analysis, and loading calculations.

Read more →
Split-screen illustration comparing an algae covered pond bottom with a clear pond after treatment
Measurements

Lake Depth and Bathymetric Surveys

How bathymetric surveys document underwater topography and volume with explicit datums, positioning, bed picking, interpolation limits, and ground truth. Covers methods, uncertainty, repeat surveys, and reconnaissance-only DIY use.

Read more →

Why Water Quality Measurements Matter

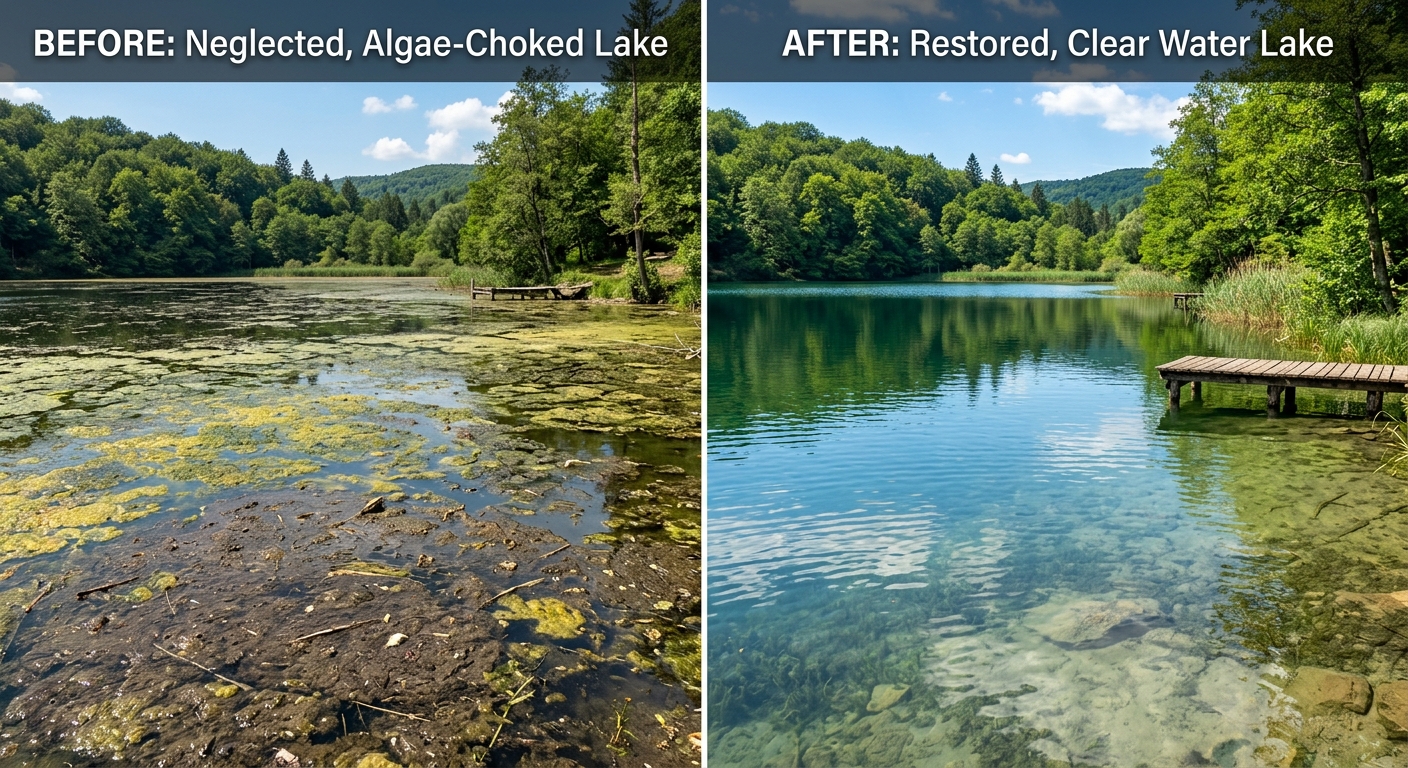
Split-screen illustration comparing an algae covered pond bottom with a clear pond after treatment

Every lake and pond is a dynamic system shaped by climate, watershed inputs, biological activity, and human use. Without measurements, management decisions are guesswork. A lake that appears healthy on the surface may have critically low dissolved oxygen at depth, excessive phosphorus fueling future algal blooms, or an accumulating sediment layer that is slowly reducing its volume.

Routine measurements transform lake management from reactive to proactive. They establish baselines, reveal seasonal patterns, quantify the effects of treatment interventions, and provide early warning of emerging problems. A well-designed monitoring program does not need to be complex, but it does need to capture the right parameters at the right times.

Core Parameters for Lake Health

The parameters most important to lake and pond management fall into three broad categories: physical, chemical, and biological. Physical measurements include water temperature, thermal stratification, water clarity, and lake depth. Chemical parameters encompass dissolved oxygen, pH, alkalinity, conductivity, and nutrient concentrations, particularly phosphorus and nitrogen. Biological indicators include chlorophyll-a concentration as a proxy for algal biomass, and in some cases direct cell counts for harmful algal bloom species.

Not every waterbody requires every parameter. A small decorative pond may only need periodic dissolved oxygen and temperature checks, while a public drinking water reservoir may require continuous multi-parameter monitoring with telemetry. The key is matching your monitoring effort to the management questions you need to answer.

  • Dissolved oxygen: a key habitat indicator whose meaning depends on temperature, depth, timing, species needs, and exposure duration
  • Water temperature: drives stratification, oxygen solubility, and biological activity rates
  • Phosphorus and nitrogen: the nutrients that control algal growth in most freshwater systems
  • Water clarity (Secchi depth or turbidity): a quick, reliable indicator of overall water quality
  • pH and alkalinity: determine buffering capacity and influence nutrient availability
  • Chlorophyll-a: a measurable proxy for the amount of algae present in the water column

Field Measurements vs. Laboratory Analysis

Some parameters can be measured directly in the field using portable meters, probes, or simple tools like a Secchi disk. Dissolved oxygen, temperature, pH, conductivity, and turbidity all fall into this category. Field measurements provide immediate results and are well suited to spatial surveys, where you need readings at multiple locations across a lake in a single visit.

Other parameters, particularly nutrient concentrations and chlorophyll-a, require water samples to be collected in the field and analyzed in a laboratory. Proper sample handling is critical: bottles must be appropriate for the analyte, samples often need to be kept on ice, and holding times before analysis are strictly limited. A dissolved phosphorus sample that sits unpreserved in a warm vehicle for hours will yield unreliable results regardless of how precise the lab instrument is.

Continuous monitoring stations bridge the gap between spot measurements and laboratory analysis. A multi-parameter sonde deployed on a buoy or fixed platform can record dissolved oxygen, temperature, pH, turbidity, and other parameters at intervals as short as every five minutes, generating the kind of high-resolution dataset that reveals diel cycles, storm responses, and seasonal trends that periodic grab samples miss entirely.

When and How Often to Measure

Measurement timing matters as much as measurement method. Dissolved oxygen in a productive lake can swing from supersaturated near the surface at midday to dangerously low before dawn, so a single afternoon reading may paint an overly optimistic picture. Temperature profiles shift dramatically between spring turnover and late-summer stratification. Nutrient concentrations spike after storm events and decline during calm periods.

A practical starting point for most managed lakes is monthly sampling during the growing season (typically April through October in temperate climates), with additional sampling after major storm events. For parameters that change rapidly, like dissolved oxygen and temperature, biweekly or continuous monitoring provides a much clearer picture. Design sampling times to capture the diel cycle relevant to your decision: pre-dawn can approximate a daily minimum in some stratified, productive systems, but the lowest dissolved oxygen may occur at depth, after storms, or during other periods depending on mixing, weather, and biomass. Document a representative timing strategy and repeat it consistently, or use continuous sensors where diel minima matter.

  • Monthly sampling provides seasonal trend data and a baseline for year-over-year comparison
  • Biweekly dissolved oxygen profiles catch rapid changes during the critical summer stratification period
  • Post-storm sampling captures nutrient loading pulses from the watershed
  • Representative timing captures diel dissolved oxygen lows relevant to your habitat or compliance question, not a single universal hour
  • Continuous sensor data resolves diel patterns and short-duration events that grab samples cannot

Ensuring Data Quality

A measurement is only useful if it is trustworthy. For field instruments, that starts with calibration. Dissolved oxygen sensors should be calibrated before each sampling event, ideally using a water-saturated air method or a zero-oxygen solution. pH meters require two-point calibration with fresh buffer solutions. Turbidity sensors need calibration against known standards and a clean optical window.

Equally important is consistency in method. Measurements taken at different depths, different times of day, or different locations from one visit to the next cannot be meaningfully compared. A monitoring program should define fixed sampling stations, standard depths for profile measurements, and a consistent time window for each visit. Recording metadata like weather conditions, recent rainfall, and any visible changes to the shoreline or water surface provides context that is invaluable when interpreting results months or years later.

FAQ

Frequently asked questions

Can I collect reliable data without expensive equipment?

Yes. A Secchi disk (under $50) provides a scientifically valid measure of water clarity. A basic dissolved oxygen meter and thermometer are relatively affordable and, when properly calibrated, produce data suitable for management decisions. Laboratory nutrient analysis typically costs $15 to $40 per sample. The most important factor is consistent methodology, not expensive instruments.

How deep should I take measurements in a lake?

Vertical profile spacing should be defined by your monitoring objective, total depth, expected stratification, sensor response time, bottom clearance, and the need for repeatable comparisons visit to visit. Add closer intervals through the metalimnion and any suspected oxygen transition zones; wider spacing may be acceptable in uniform deep water when the program documents that choice. Secchi depth is always measured from the surface.

When is the best time of day to sample a lake?

Dissolved oxygen varies over the day and with depth, mixing, and weather, so no single clock time is universally the most conservative fish-habitat indicator. Pre-dawn surface readings can approximate a daily minimum in some productive, stratified ponds, but deep hypolimnion lows, post-storm mixing, and other contexts may differ. Define a representative sampling design for your objective (surface, profile, or continuous logging), keep station, depth, and timing consistent visit to visit, and avoid heavy-wind events that temporarily disrupt stratification.

How do I know if my lake data is showing a real trend or just normal variation?

At least three to five years of consistent data are typically needed to distinguish real trends from year-to-year variability driven by weather. Statistical methods like the seasonal Kendall test are designed for water quality trend detection. Comparing your data to regional reference conditions or state water quality standards also provides useful context for interpretation.

Ready to get started?

Start planning your Measurements project today

Describe your waterbody and get guidance on the right monitoring approach from the LakeTech team.

Start a product inquiry