Zero at the Bottom
A lagoon management team reached out to LakeTech with a familiar concern: their water quality seemed to be declining despite having a paddle boat aeration system in place. Algae pressure was increasing, odor complaints were coming in, and the general assumption was that the aeration system had reached the end of its useful life and needed to be replaced entirely. Replacing a paddle boat aerator is not a small expense. Before committing to that investment, the team wanted data to confirm whether the system was actually failing or whether something else was going on. That is exactly the kind of question real-time monitoring is built to answer. LakeTech deployed sensors at both the surface and bottom of the South Lagoon, measuring dissolved oxygen, temperature, and salinity continuously. The data told a clear story within the first 48 hours.
- Lagoon managers suspected their aeration system had failed
- Full replacement would have been a significant capital expense
- LakeTech deployed surface and bottom sensors for continuous monitoring
- Data provided a definitive answer within days
What the Data Revealed
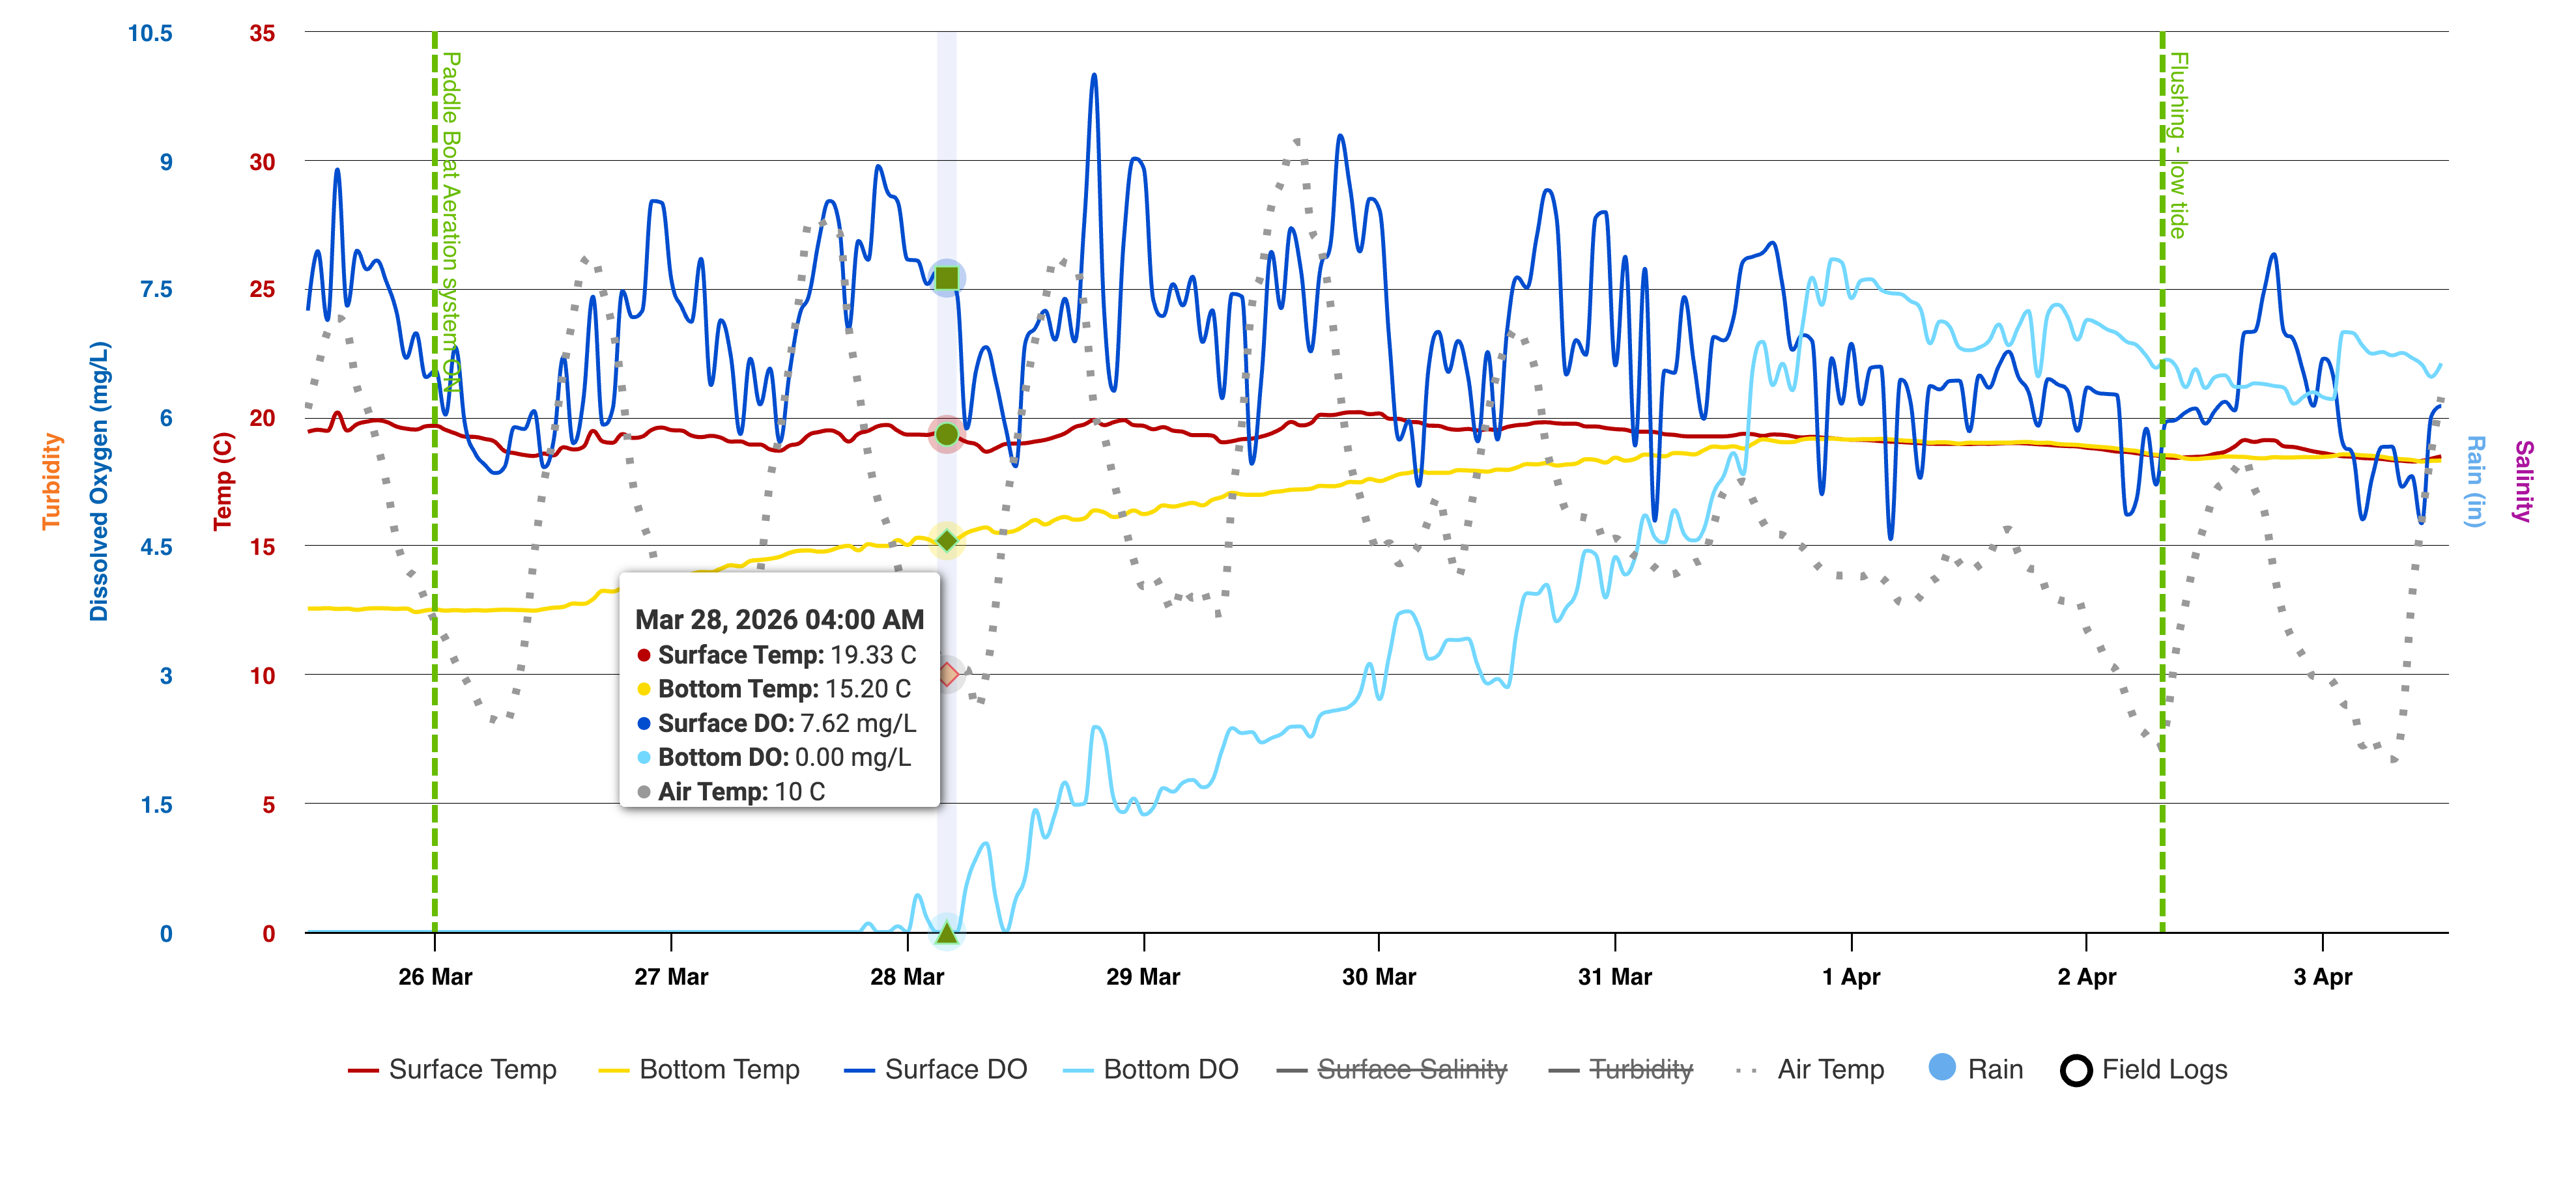
The chart from South Lagoon tells the story plainly. On March 26, a field log marks the paddle boat aeration system as active. Surface dissolved oxygen (the dark blue line) is behaving normally, fluctuating with the expected diurnal pattern between roughly 6 and 9 mg/L as photosynthesis ramps up during the day and respiration draws it down overnight. The surface is getting oxygen. The system appears to be running. But look at the bottom. The light blue line representing bottom dissolved oxygen sits at exactly 0.00 mg/L for days. Not low. Not declining. Zero. Complete anoxia at the bottom of the water column while the surface looks healthy. That is the signature of an aeration system that is running but not actually mixing the water column. The paddle wheel is turning, but the oxygen is not reaching the bottom. The temperature data confirms the diagnosis. Surface temperature (red) holds steady around 19 to 20°C while bottom temperature (yellow) sits well below at 15°C and gradually diverges. The water column is stratified. A properly functioning aeration system would be breaking down that thermal barrier and pushing oxygenated surface water toward the bottom. The fact that stratification persists while the aerator runs proves the system is not delivering adequate mixing. Around March 28 to 29, the bottom DO finally begins to show some recovery, climbing from zero into the low single digits. This partial recovery, combined with the fact that surface DO remained healthy throughout, confirmed the aeration unit was mechanically operational but underperforming. It was not dead. It was impaired.
- Surface DO fluctuated normally between 6 and 9 mg/L with healthy diurnal patterns
- Bottom DO flatlined at 0.00 mg/L for multiple days despite aeration running
- Temperature stratification persisted: 19 to 20°C at surface, 15°C at bottom
- Partial bottom DO recovery after March 28 indicated the system was impaired, not dead
Repair, Not Replace
This is where the data changed the outcome. Without continuous monitoring, the lagoon team had two options on the table: spend a significant amount on a full aeration system replacement, or keep running a system they suspected was failing and hope for the best. Neither option was informed by evidence. With the LakeTech data in hand, the diagnosis was precise. The aeration system was mechanically running but not achieving adequate destratification. That pointed to specific, repairable issues: impeller wear, positioning problems, reduced paddle efficiency, or partial mechanical obstruction. The system did not need to be torn out and replaced. It needed to be serviced. The management team was able to schedule a targeted repair rather than a full capital replacement. The real-time data gave them the confidence to make that call and the documentation to justify it to stakeholders. When you can show a chart that says "the aerator turned on here and bottom oxygen stayed at zero for three days," that is a conversation ender. No one argues with the data.
- Data ruled out total system failure and identified an impairment issue
- Targeted repair was pursued instead of full replacement
- Significant cost savings compared to new equipment procurement
- Monitoring data provided clear documentation for stakeholder reporting
Why Spot Checks Would Have Missed This
Here is the part that matters for every lake and lagoon manager reading this. If the team had relied on periodic spot checks instead of continuous monitoring, they almost certainly would have missed the real story. Imagine showing up on a Tuesday afternoon with a handheld meter and measuring surface dissolved oxygen at 7.5 mg/L. You might walk away thinking the system is fine. Surface looks great. You would have no idea that the bottom has been anoxic for days. And if you happened to measure on March 29 after the partial recovery, bottom DO might have read 2 or 3 mg/L, which is low but not alarming enough to trigger an emergency response. You would miss the fact that it was at zero for 72 hours straight. Continuous, multi-depth monitoring captures the full picture: the timing of events, the duration of anoxic episodes, the relationship between surface and bottom conditions, and the response (or lack of response) to management actions like turning on an aerator. A single data point cannot tell you any of that. A continuous record can. The field log markers and flushing event annotations on the chart also demonstrate the value of integrating management actions directly into the monitoring timeline. When you can overlay "paddle boat aeration system on" against the DO response at depth, you are not guessing about cause and effect. You are measuring it.
- A single surface reading on any given day would have shown healthy DO
- Bottom anoxia lasting 72+ hours would have been completely invisible without continuous data
- Multi-depth sensors captured the stratification that a single-depth check would miss
- Field log integration ties management actions directly to measured water quality response
Continuous Monitoring Pays for Itself
This case study is a straightforward example of monitoring paying for itself in a single decision. The cost difference between repairing an existing aeration system and purchasing a full replacement can be tens of thousands of dollars depending on the system and site. The LakeTech monitoring deployment that produced this data costs a fraction of that. More importantly, the data does not just answer one question. Once the sensors are deployed, they continue providing value: tracking the effectiveness of the repair, detecting future performance degradation before it becomes a crisis, and building the long-term dataset that makes every management decision smarter than the last. If you manage a lake, lagoon, or pond with aeration, fountain, or mixing equipment, continuous monitoring is the only way to verify your systems are actually doing what they are supposed to do. Surface conditions can look fine while the bottom tells a completely different story. The only way to know is to measure it.