

What water quality reporting software actually does
At its simplest, reporting software takes data from one format and exports it in another. But the useful version does more than that: it knows which data belongs to which site, which time period is being reported, and which parameters or observations are most relevant for the specific audience receiving the report. An HOA board needs different information than an environmental regulator, and a property owner receiving a seasonal summary needs something different than a technical consultant reviewing trend analysis.
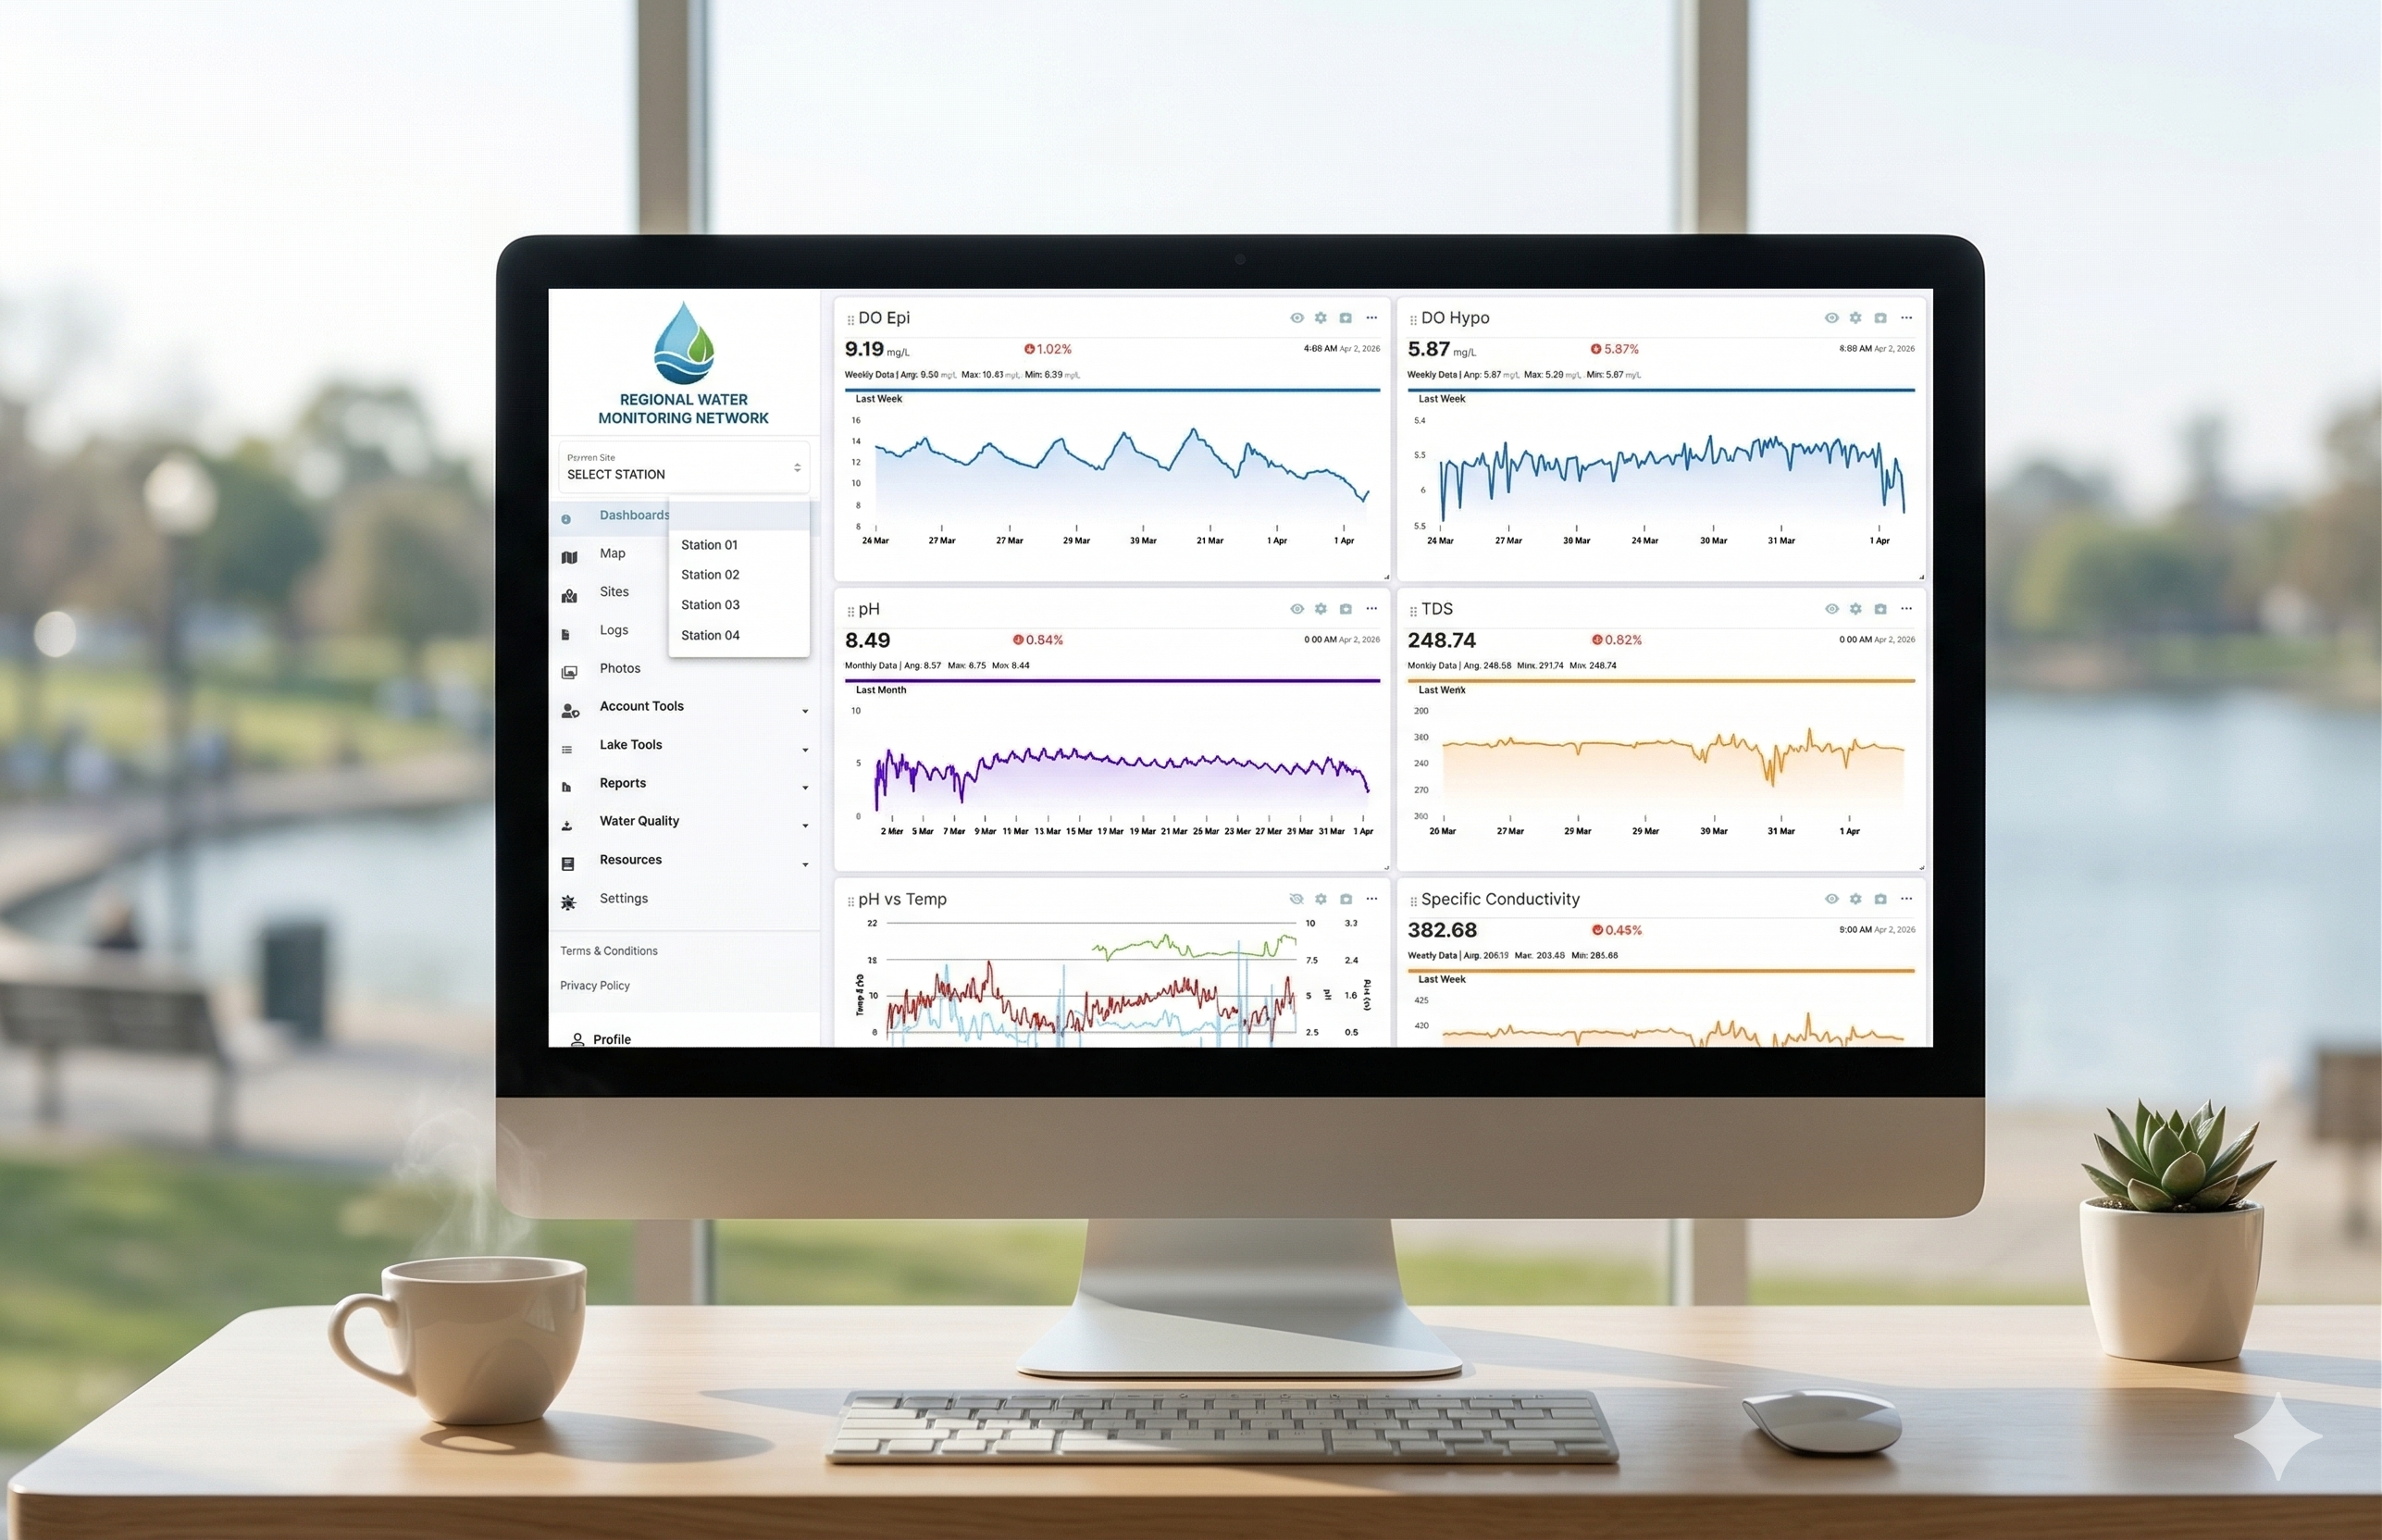
Good reporting software lets you configure report templates that pull the right data fields, apply consistent formatting, and include trend charts without requiring manual chart creation each time. Once the templates are set up, generating a report should take minutes rather than hours.
- Report templates should be configurable per client or report type, not one-size-fits-all.
- Automatic chart generation from stored data eliminates manual formatting work.
- Audience matters: HOA boards, regulators, and property owners need different levels of detail.
Connecting lab results to the reporting workflow
Lab reports are often the hardest data to work with in a reporting workflow. They come back as PDFs from an external laboratory, in formats that vary by lab, with parameter names and units that may differ from what you use internally. The practical question is how that data gets from the PDF into a format that can be displayed in a trend chart alongside previous results from the same site.
Drag-and-drop lab report upload is one part of the solution. The other part is whether the system can extract structured data from the uploaded report, or at minimum, whether it makes manual data entry fast and consistent enough to keep up with the volume of results coming in.
- Drag-and-drop upload handles the file management side of lab result ingestion.
- Structured data extraction or consistent manual entry makes results chartable over time.
- Linking lab results to site records is what makes trend comparison possible.
How to evaluate reporting quality before committing to a platform
Ask to see an example report generated by the software for a scenario similar to your own. Look at whether the charts are readable without a technical explanation, whether the parameter names will make sense to your clients, and whether the format is professional enough to send without additional editing.
Also ask how the report handles missing data. If a lab result is delayed or a field visit was skipped, a well-designed report will note the gap clearly rather than generating a misleading chart or silently omitting the time period.
- Example reports should be legible to a non-technical HOA board member or property owner.
- Check how the system handles missing data periods, gaps should be clearly labeled.
- Professional formatting should not require post-export editing in Word or InDesign.