
What real-time monitoring captures
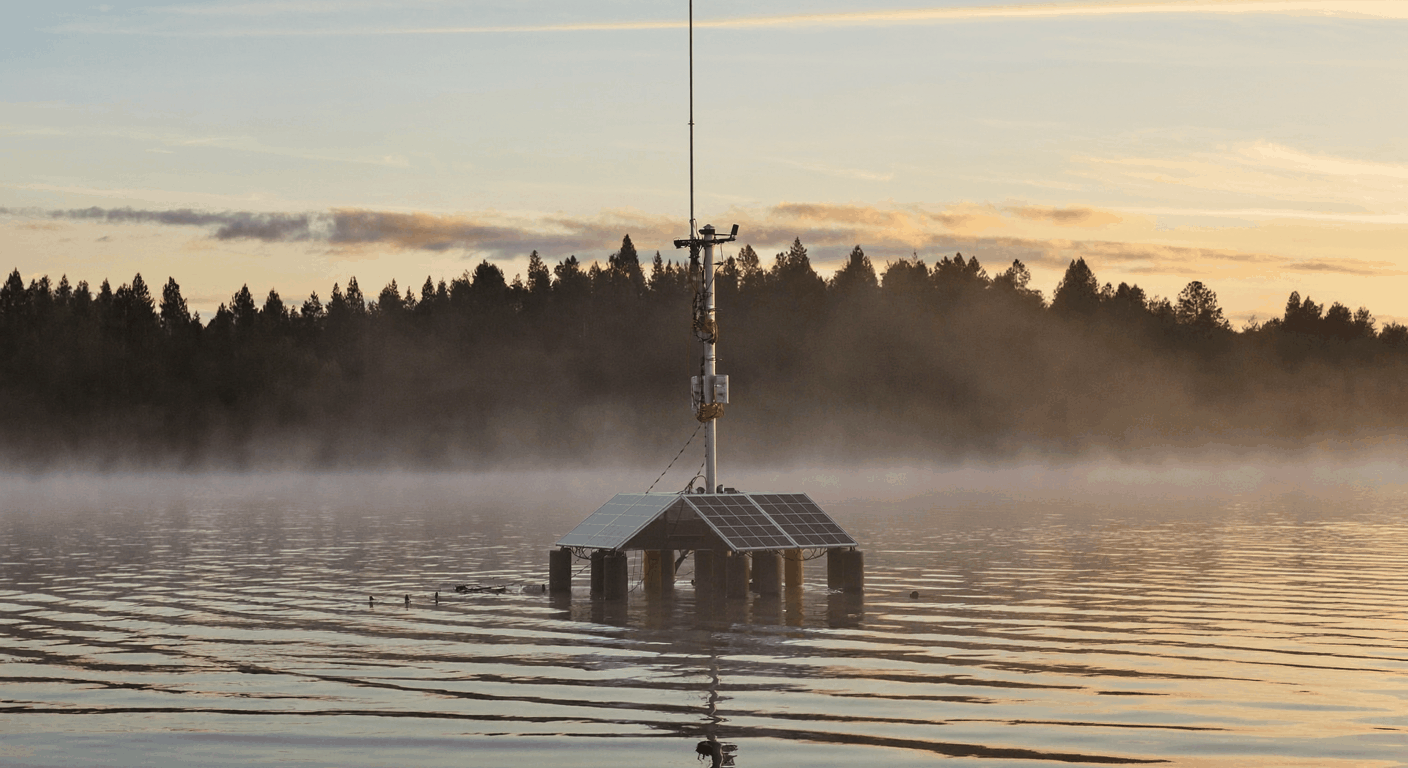
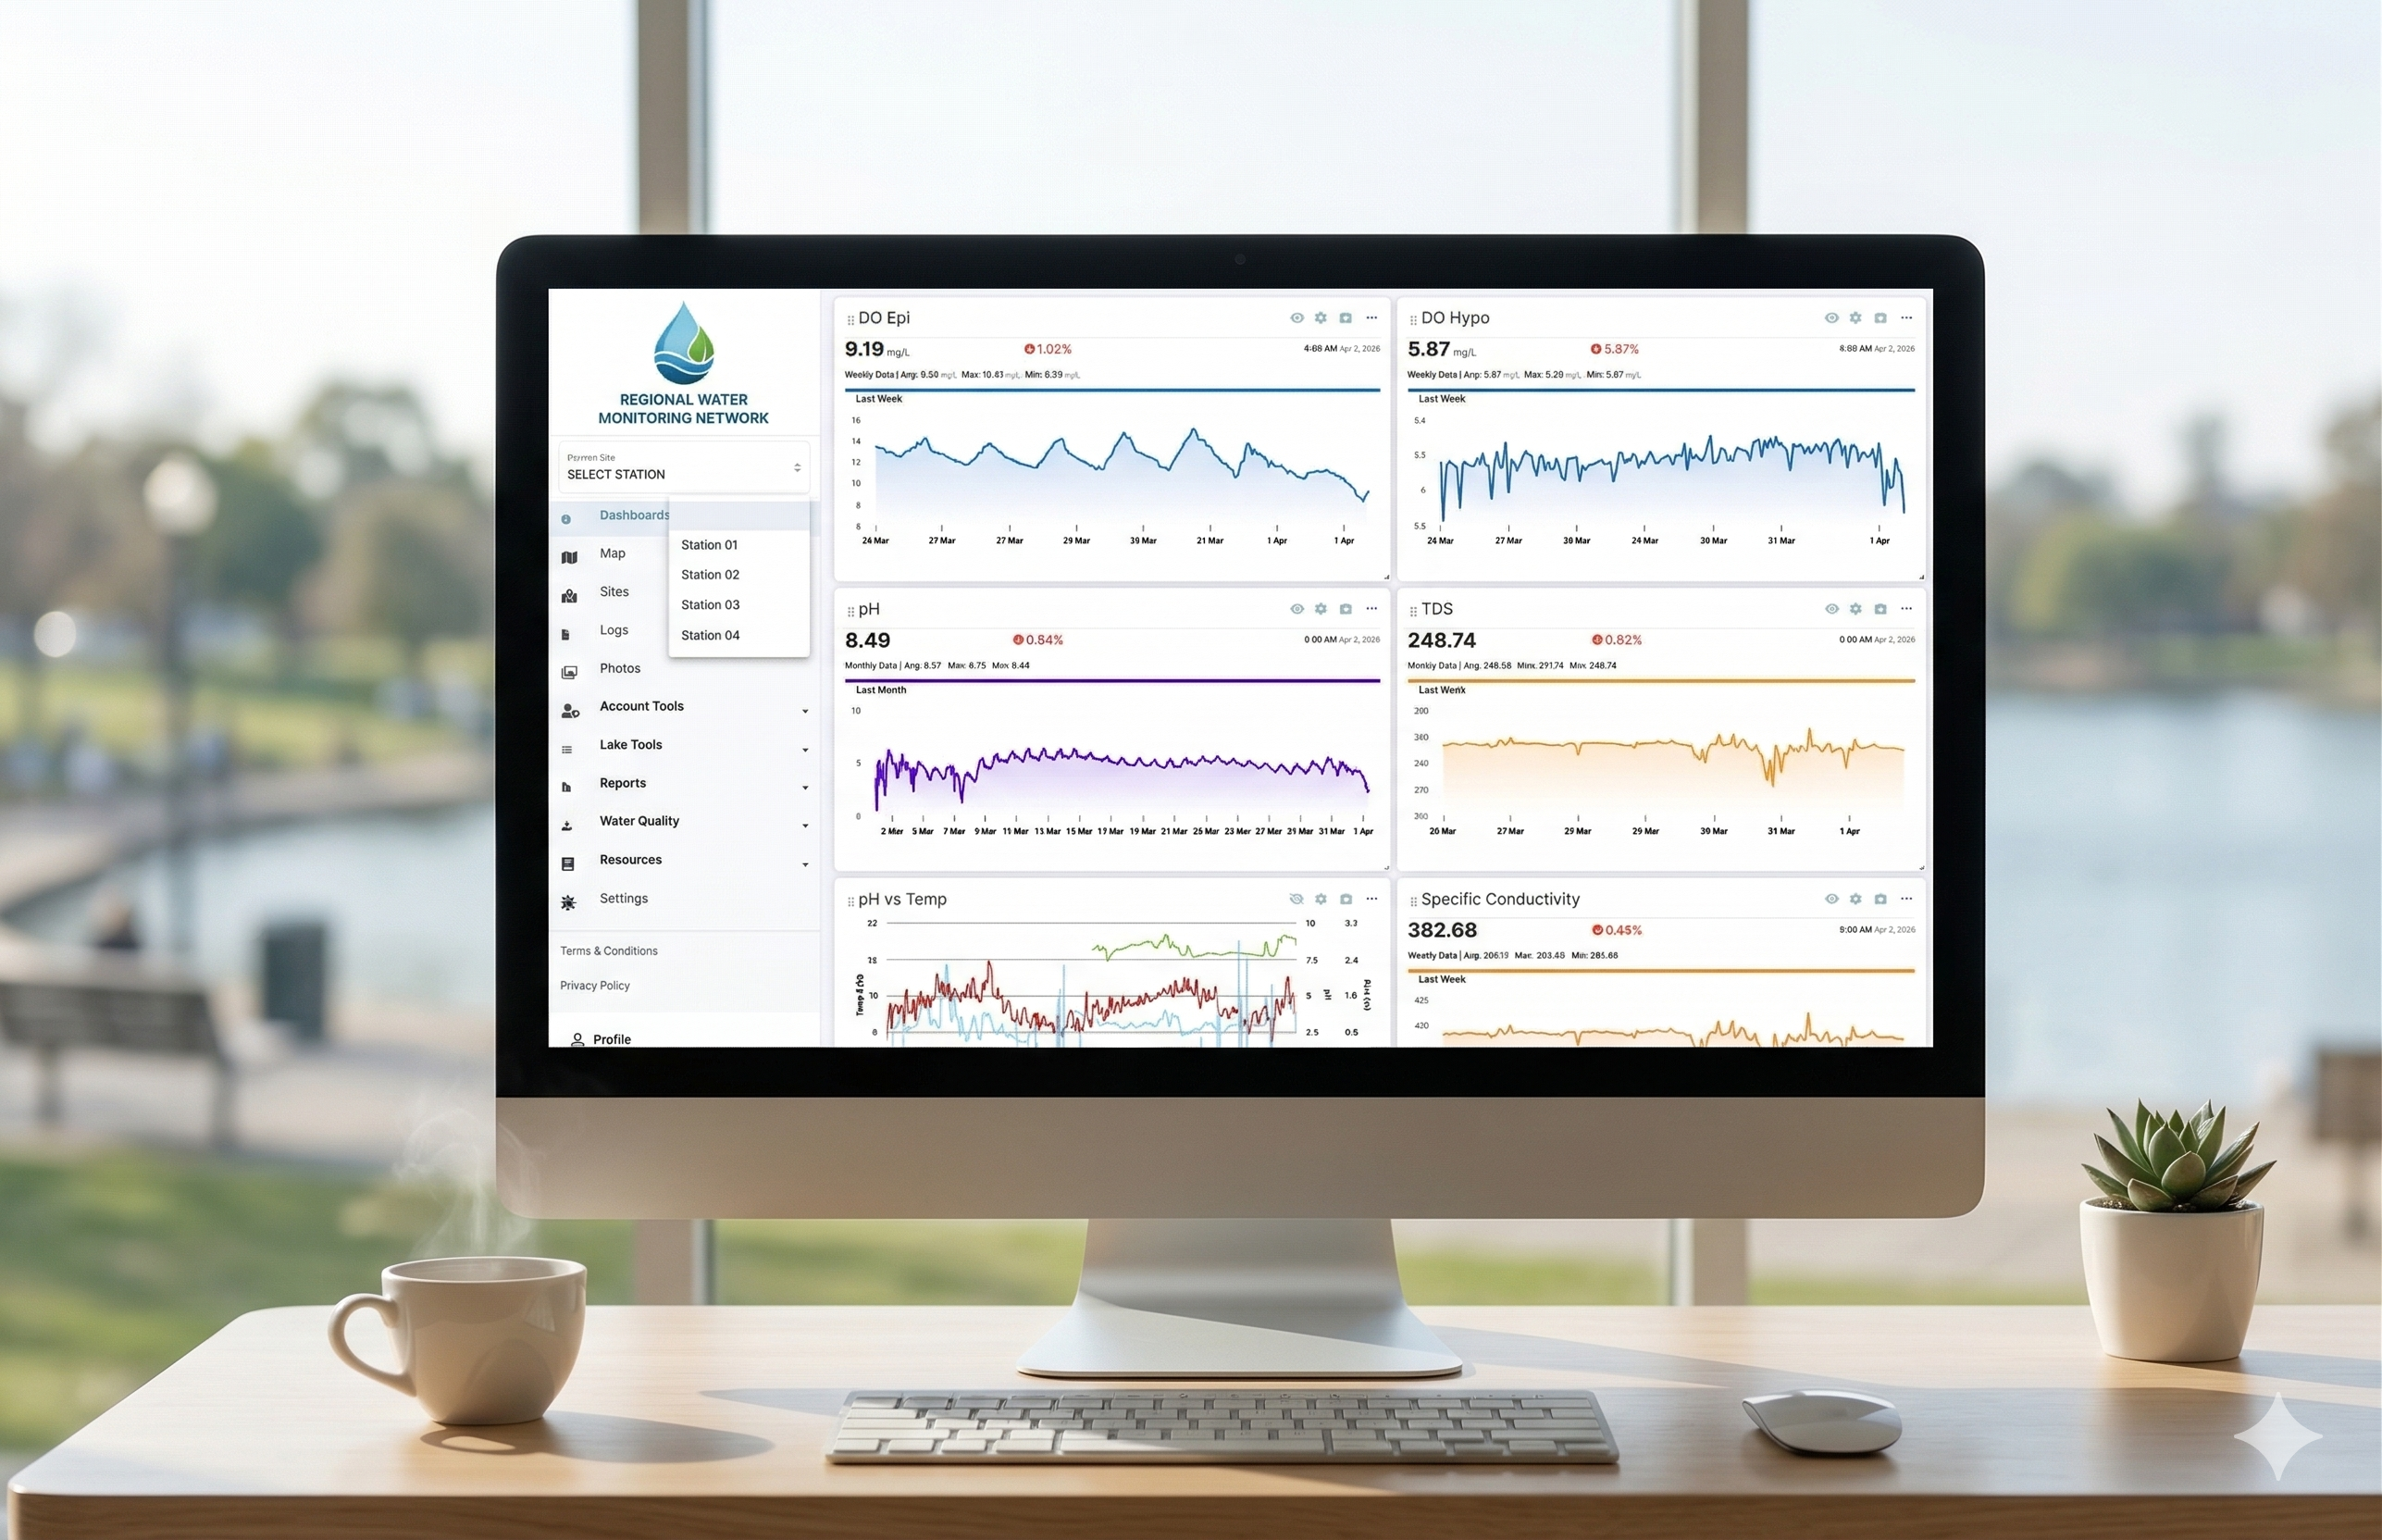
Real-time water quality monitoring typically uses a buoy or fixed sensor station that continuously measures parameters and transmits readings at set intervals, often every 15 minutes or every hour, depending on the system. The most commonly monitored parameters are dissolved oxygen, water temperature, pH, and specific conductance. Some systems also measure turbidity, chlorophyll-a (as a proxy for algae), or blue-green algae fluorescence.
The value is not in any single reading. It is in the pattern across hundreds or thousands of readings that would be impossible to collect manually. A dissolved oxygen curve over a 24-hour period tells a very different story than a single spot-check taken at 9 a.m.
- Readings every 15 to 60 minutes create patterns that single spot-checks cannot reveal.
- Dissolved oxygen and temperature are the highest-priority parameters for most pond management situations.
- Continuous data also captures overnight conditions that field visits almost never catch.
Setting useful alerts
A monitoring system without alerts requires someone to watch a dashboard constantly. The practical value comes from configuring thresholds that trigger a notification when a parameter crosses into a range that requires attention. A dissolved oxygen drop below 4 mg/L is the most common example: it signals a developing stress condition before fish are visibly affected.
Good alert design requires understanding what normal looks like for a specific waterbody before setting thresholds. A pond that naturally runs lower dissolved oxygen in late summer has a different normal range than one that is consistently well-oxygenated. Setting alerts based on general guidelines rather than site baseline will produce false positives and lead staff to ignore notifications.
- Alerts should be based on site-specific baselines, not universal default thresholds.
- Dissolved oxygen drop alerts are the most operationally important for fish-bearing ponds.
- Too many false-positive alerts train staff to ignore notifications, calibrate carefully.
How real-time data connects to the rest of your records
Monitoring data is most useful when it sits alongside field logs and lab results in the same system. A spike in turbidity on the monitoring chart followed by a field visit note and then a lab result a week later tells a coherent story. The same data in three separate places requires someone to reconstruct that story manually every time a client asks what happened.
LakeTech's platform connects monitoring feed data to the same site record as manual logs and uploaded lab reports. That means the full picture of a waterbody is visible in one place, with timestamps that make it possible to trace cause and effect across data types.
- Monitoring data alone is not the full picture: it needs field context.
- Connecting live data to lab results and field logs makes trends interpretable.
- A unified record system eliminates the reconstruction work that disconnected tools require.