
What the satellite actually sees
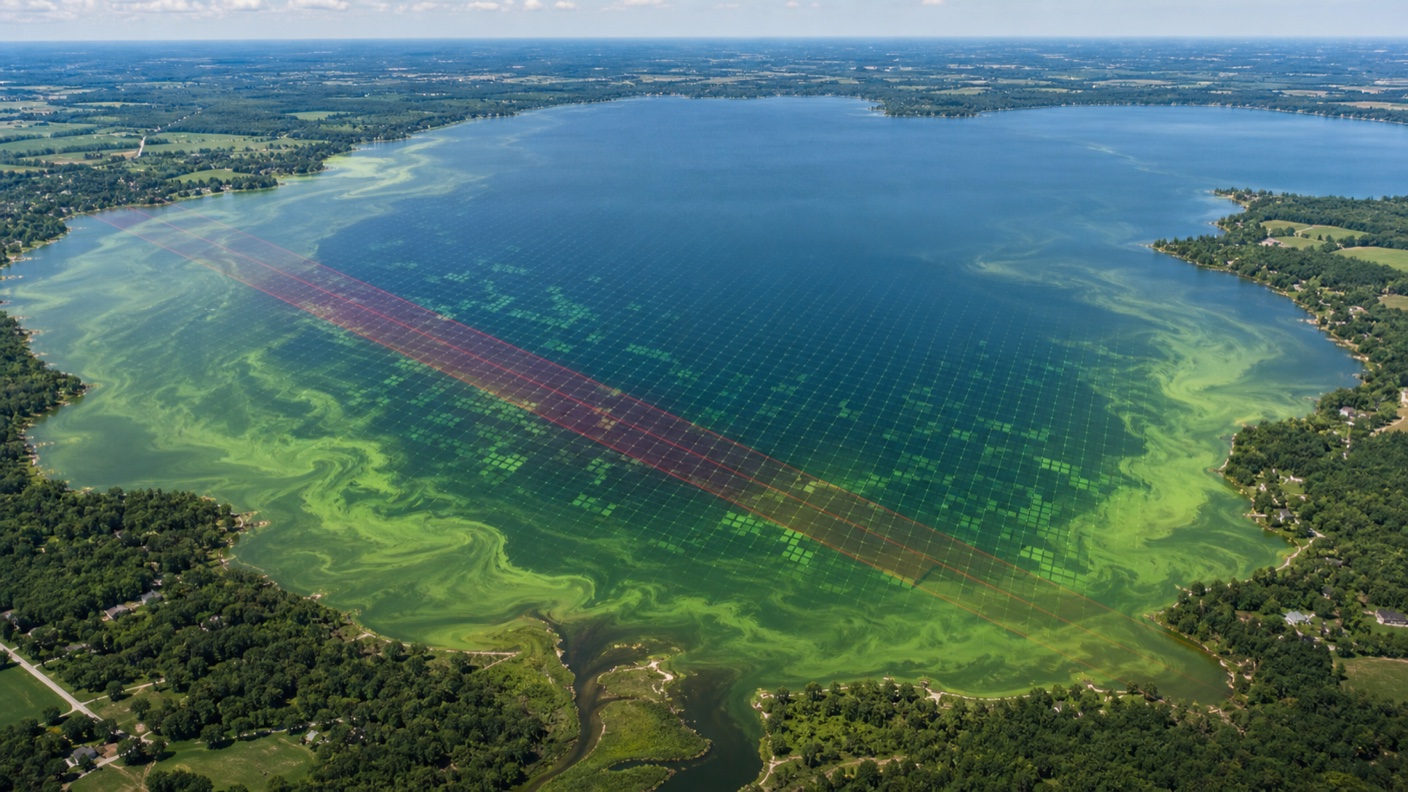
Sentinel-2 carries a multispectral imager that records reflected sunlight in visible, near-infrared, and red-edge bands. Those bands are useful because water with more phytoplankton changes the balance of red and red-edge reflectance compared with clearer water.
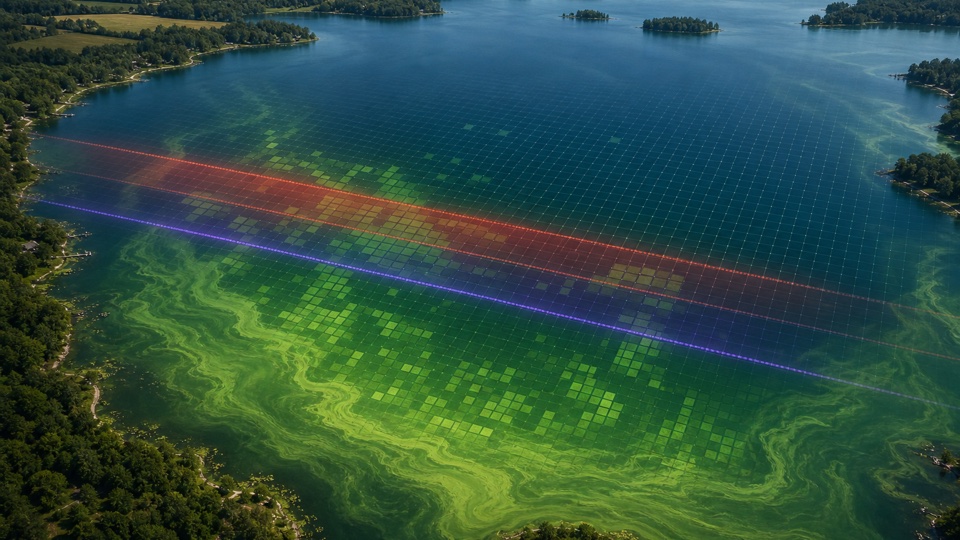
LakeTech uses that spectral fingerprint as a chlorophyll-a proxy. The workflow starts with the saved lake boundary, removes cloudy or shoreline-contaminated pixels, and compares the bands most sensitive to algae pigments. The result is a map and time series that show where algae pressure is rising or falling.
This is not a replacement for a lab chlorophyll sample. It is a fast, spatial view of the lake between field visits, which makes it useful for screening, trend review, and deciding where to sample next.
- Sentinel-2 provides red and red-edge bands that are well suited to algae-pigment screening.
- LakeTech uses only lake-safe interior pixels so docks, shorelines, and shallow edge artifacts do not dominate the result.
- Clouds, haze, and shadows are filtered because they can change reflectance more than the lake condition itself.
- The app displays the result as a management-friendly chlorophyll-a proxy, not as a certified lab value.
- Surface optical estimates are not direct measurements of toxins, dissolved oxygen, nutrients, or whole-water-column conditions; they require local field validation and must not alone drive reopening or treatment decisions.
How LakeTech turns imagery into a lake parameter
A satellite scene is first clipped to the waterbody outline saved in LakeTech. The system then places sampling points away from shore, checks the available scene dates, and applies the product's cloud limit before calculating the index.
For chlorophyll-a, the important step is comparing the red and red-edge signal. Algae pigments absorb and scatter light differently than clear water, so that band relationship can be used to estimate a bloom-related signal across the waterbody.
After calculation, the values are stored with the lake's satellite product record. The same values can power the map, dashboard widgets, downloadable CSV rows, and long-term trend charts.
- Boundary first: the lake outline controls which pixels are eligible.
- Scene screening second: cloudy scenes are rejected before values are trusted.
- Index calculation third: red and red-edge reflectance become a chlorophyll-a proxy.
- Storage last: results become reusable LakeTech data rather than one-off imagery.
Why chlorophyll-a from satellite imagery matters
Chlorophyll-a is one of the clearest signs of algae biomass. When it rises quickly, a lake may be moving toward a bloom, especially if nutrients, heat, and calm weather are also present.
A satellite view helps managers see spatial patterns that a single dock sample can miss. One cove may be intensifying while open water still looks acceptable. One side of the lake may respond to runoff before the rest of the basin changes.
That context supports better field decisions: where to send staff, where to collect a confirmatory sample, which stakeholder questions need a map, and whether treatment timing should change.
- Find bloom hot spots before a visual complaint is the first warning.
- Compare coves, inlets, and open-water zones from the same scene.
- Track whether nutrient or algae management is changing the seasonal pattern.
- Use satellite trends to guide field sampling, not to replace it.