
What the satellite actually sees
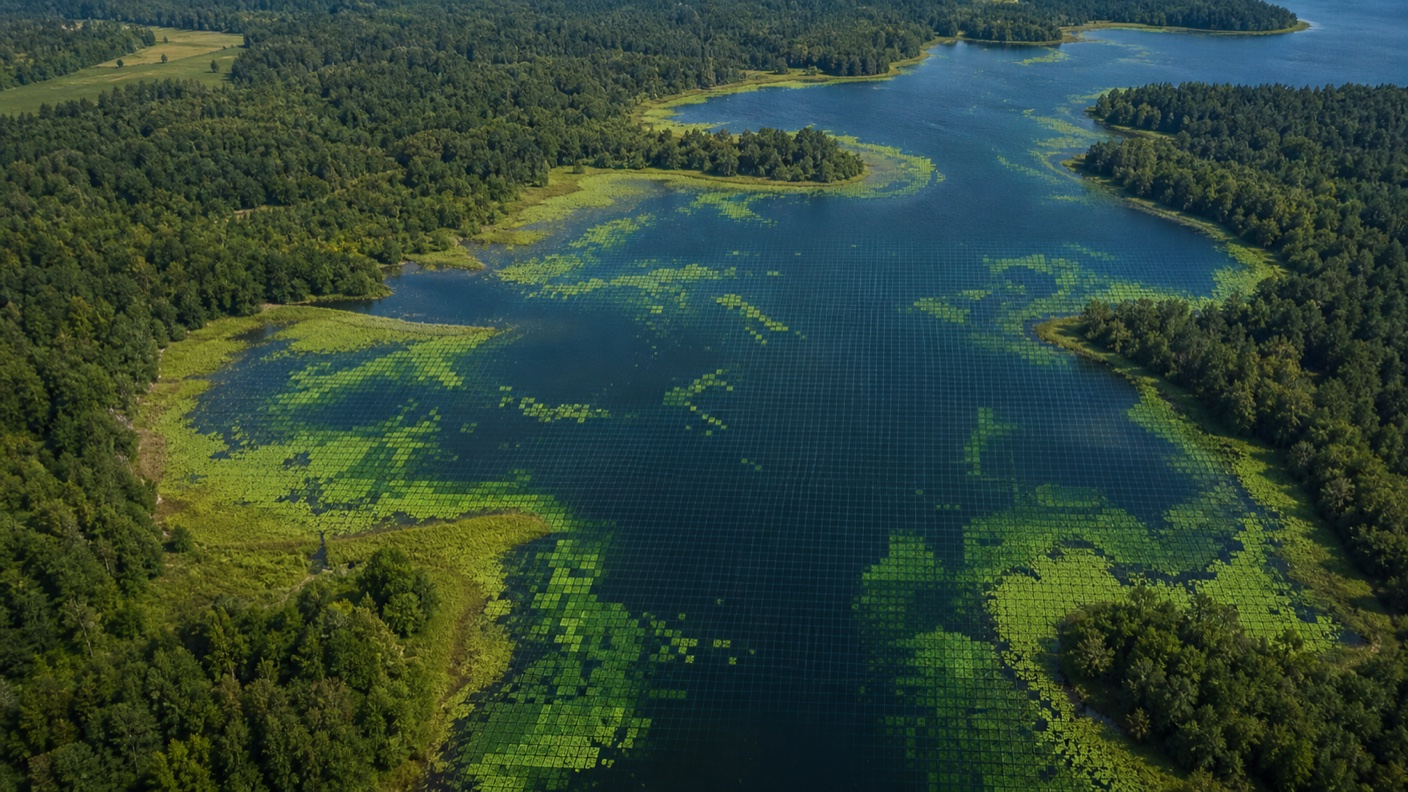
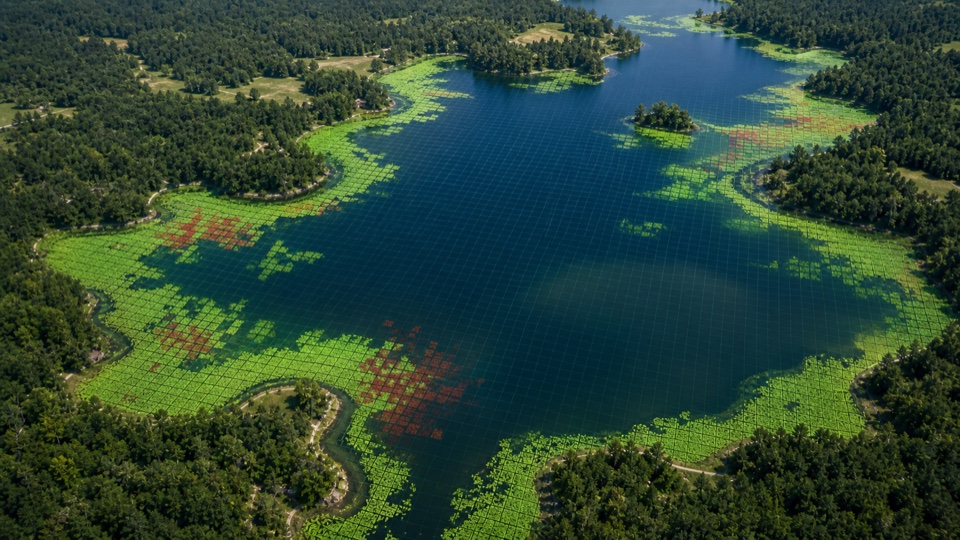
Open water absorbs much of the near-infrared light that reaches it. Floating vegetation, surface mats, and emergent plant material reflect more near-infrared light, creating a strong contrast in multispectral imagery.
LakeTech uses that contrast to build a vegetation index for lake pixels. The product is designed for floating or surface-visible cover, not for every rooted plant growing below the surface.
The result is most useful as an extent and trend layer: where surface vegetation is present, how much of the waterbody it covers, and whether the pattern is changing after weather, treatment, or seasonal growth.
- Red and near-infrared bands separate plant material from open water.
- The output is a coverage index, not a species identification model.
- Shoreline buffers help reduce confusion with lawns, trees, docks, and banks.
- Repeated scenes make it possible to track spread and retreat through the season.
- Surface optical estimates are not direct measurements of toxins, dissolved oxygen, nutrients, or whole-water-column conditions; they require local field validation and must not alone drive reopening or treatment decisions.
How LakeTech turns scenes into a coverage layer
LakeTech starts with the same boundary-first workflow used by the other satellite products. The lake outline defines eligible pixels, and automatic sampling points are placed far enough from shore to reduce mixed land-water signals.
For floating aquatic vegetation, the system compares red and near-infrared reflectance. High vegetation contrast is translated into an index and displayed as a map layer that can be compared from date to date.
Managers can use the map alongside field notes, treatment logs, and photos to understand whether the observed plant response is localized or lake-wide.
- Boundary and shoreline buffers protect the calculation from land pixels.
- Cloudy scenes are skipped before the vegetation index is calculated.
- Coverage values can be reviewed spatially on the map and over time in charts.
- The product pairs well with field inspection because plant species still require ground truth.
Why floating vegetation data matters
Floating vegetation can change lake usability quickly. One sheltered cove may become difficult to boat through before the main basin shows obvious symptoms. Satellite imagery helps identify those patterns before the problem is reduced to a single complaint.
The data also helps evaluate treatment timing and coverage. If a treatment zone improves while another shoreline continues to expand, managers can adjust the plan with better spatial context.
For stakeholders, maps are easier to understand than scattered observations. A seasonal vegetation layer can show whether a lake is improving, holding steady, or moving into a higher-risk plant coverage pattern.
- Track surface vegetation spread across coves, inlets, and shoreline pockets.
- Compare plant response before and after treatment windows.
- Prioritize field inspections where satellite contrast changes most.
- Communicate plant coverage patterns with maps rather than anecdotes.